ATT my results show the health of your AT&T connection to the gateway—not your real-world Wi-Fi experience. In 2026, this data is also pushed into AT&T Smart Home Manager, and support teams increasingly use it to approve (or deny) technician visits and service credits. If your dashboard is green, but latency is over 100ms—or your 5G metrics (RSRP/SINR) are weak—you likely have local interference or gateway placement issues, not a “perfect connection.”
The “Green Checkmark” Trap (Why Your Internet Feels Bad When the Dashboard Says It’s Fine)
You’re buffering on a 10-second clip. The dashboard says, “Great connection.” Now you’re annoyed—and confused. Welcome to the green checkmark trap.
In 2026, att my results primarily confirm whether the line to your gateway is intact. A green status usually means the cable isn’t physically damaged. It does not guarantee:
- Strong in-home Wi-Fi
- Acceptable latency for gaming or calls
- Stable performance during peak hours
Support agents increasingly rely on this green status to gatekeep technician visits and, in some cases, to deny service credits. Knowing how to interpret (and challenge) the dashboard is the difference between getting real help and going in circles.
What Is AT&T My Results (and What It’s Not)
AT&T My Results is AT&T’s diagnostic view of your connection health—speed to the gateway, stability, packet loss indicators, and line quality. It’s the data source behind the alerts you see in AT&T Smart Home Manager.
It is:
- A snapshot of line health and recent tests
- A tool that supports teams’ use to decide escalation
- A baseline for outage and degradation checks
It is not:
- A full picture of your Wi-Fi quality
- A promisethat your experience will feel fast
- A replacement for local device testing
2026 reality: With smart homes, cameras, and work-from-home loads, line health can look “perfect” while your living-room Wi-Fi is struggling.
How to Access AT&T My Results in 2026 (Step-by-Step)
Option A: From Your AT&T Account
- Sign in at the official site for AT&T.
- Go to Internet → Support → Diagnostics / Speed test.
- Open the detailed results view to see My Results.
Option B: From the Speed Test Page
Run the official speed test, then tap View detailed results. Bookmarks from 2023–2024 often redirect incorrectly due to tool consolidation—use the support path above if you hit a loop.
Common issues (quick fixes):
- Login loop: Clear cookies for att.com, then re-sign in.
- Blank page: Temporarily disable aggressive ad blockers.
- Mobile vs desktop mismatch: The app shows alerts; the browser shows raw diagnostics. They read from the same source.
Also Read: Unblock proxy: A Complete Guide to Safe and Open Internet Access
How to Read the Dashboard
| Metric | What AT&T Shows | What It Means for You |
|---|---|---|
| Download/Upload | Throughput to the gateway | Line speed, not Wi-Fi quality |
| Latency | Network delay | >100ms = noticeable lag |
| Stability | Drops/packet loss | Drops cause buffering |
| Line health | Signal quality | Physical line vs in-home issues |
Latency “Traffic Light”
- <20ms (Green): Pro gaming/VR-ready
- 20–50ms (Yellow): Smooth calls, 4K streaming
- >100ms (Red): The experience is bad—even if the dashboard is green
AT&T Smart Home Manager vs. AT&T My Results (2026)
People mix these up:
| Tool | Role | What to Use It For |
|---|---|---|
| att my results | Data source | Line health, stability, diagnostics |
| AT&T Smart Home Manager | Interface | Real-time alerts, device views, Wi-Fi tips |
2026 update: My Results data is pushed into Smart Home Manager for alerts like “network instability detected.” The app is the window; My Results is the engine.
Fiber vs. Internet Air: Why Results Look Different
| Service | Typical Latency | Common Issues | What My Results Often Misses |
|---|---|---|---|
| AT&T Fiber | 5–20ms | Wi-Fi congestion | Router placement, mesh issues |
| AT&T Internet Air | 30–80ms (can spike) | RF interference | RSRP/SINR degradation |
Fiber lines test clean even when Wi-Fi nodes misbehave. Internet Air performance swings with tower load and local interference.
The 3-Layer Internet Diagnosis Model™ (Ownable Framework)
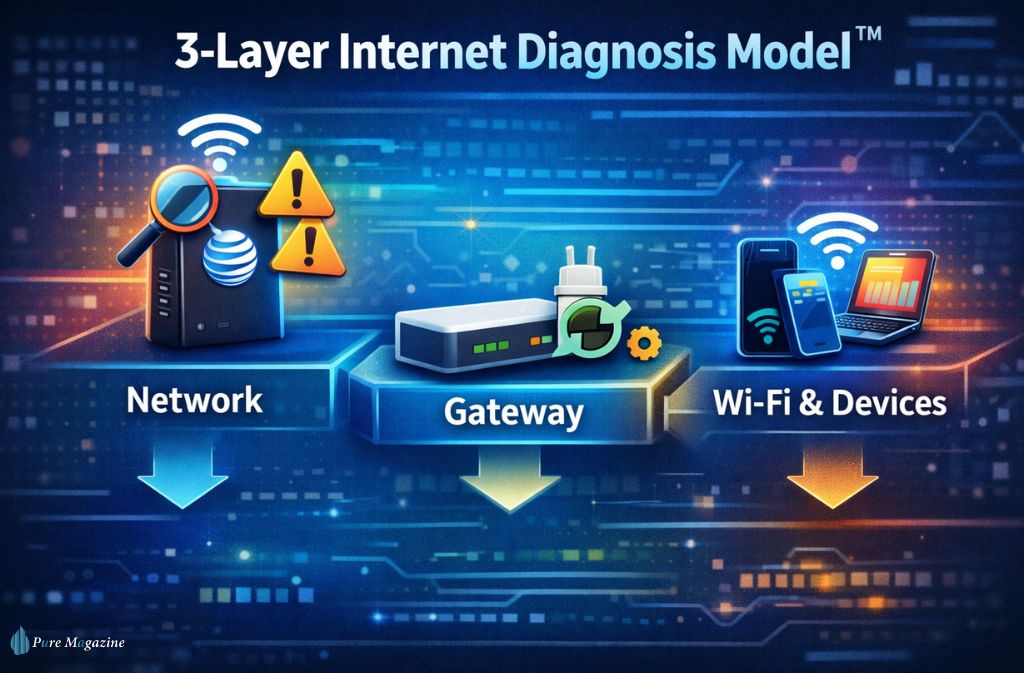
Slow internet? Follow the flow:
Network (AT&T side)
↓ Check My Results for outages/degradation
↓
Gateway (your modem/router)
↓ Power cycle, firmware update, placement
↓
Wi-Fi & devices
↓ Ethernet test → band selection → background uploads
Why this works: It isolates where the problem lives so you don’t chase the wrong fix.
Technical Depth for 2026: RSRP & SINR (5G Home Users)
If you’re on Internet Air, two radio metrics matter:
- RSRP (Reference Signal Received Power): How strong the 5G signal is
- SINR (Signal to Interference plus Noise Ratio): How “clean” that signal is
Translation:
Strong RSRP with poor SINR = lots of interference. You can have “bars” and still have a bad performance. Repositioning the gateway a few feet can change the SINR enough to fix lag.
Support Script (When the Dashboard Is Green but You’re Lagging)
Use this with support:
“My My Results shows line health is 100%, but I’m consistently seeing 150–200ms latency and unstable performance. On 5G backup, my RSRP and SINR indicate local interference. I verified with a calibrated Ethernet Cat8 connection to rule out Wi-Fi. I need an on-site evaluation.”
Why it works: You’re referencing metrics support teams recognize, which reduces “have you tried rebooting” loops.
How to Use My Results to Argue for a Bill Credit
This is the move most guides miss:
Do this:
- Screenshot repeated instability/high latency from My Results
- Pair with timestamps of dropped calls/work disruption
- Include Smart Home Manager alerts showing “network instability.”
- Request a service reliability review (not just a speed test)
Patterns get credits approved more often than one-off slow tests.
Error States & What They Usually Mean (2026)
- Gateway unreachable: Local power/Wi-Fi issue or modem crash
- Line degradation detected: Physical line or neighborhood node issue
- Authentication error: Account/session problem; log out/in
- Test failed: Peak congestion or tool outage—retry off-peak
Before deep troubleshooting, check the official AT&T Outage Map.
Also Read: How to Stay Ahead in Tech with Smarter Connectivity Options
Security & Privacy (Quick Reality Check)
My results show performance metrics, not your browsing history. Anyone with account access can view diagnostics, so log out on shared devices.
Quick “Self-Diagnose in 3 Minutes” Checklist
- Run one test on Ethernet, one on Wi-Fi
- Compare latency to the traffic-light table
- Move the gateway 3–6 feet and retest (Internet Air)
- Check Smart Home Manager alerts
- Screenshot patterns before calling support
When to Call AT&T (High-Intent Triggers)
- Latency >100ms for days
- Line health warnings for 24+ hours
- Gateway lights are blinking red
- Repeated packet loss
- Failover activates multiple times/day
FAQs
Q. How do I access AT&T My Results?
You can access att my results by logging into your AT&T account, opening Internet support tools, and selecting Diagnostics or View detailed speed test results. This opens your connection health dashboard.
Q. How accurate is AT&T My Results?
AT&T My Results is accurate for your line’s connection to the gateway, but it does not measure in-home Wi-Fi quality, router placement, or device performance. Your real-world speeds can feel slower even when results look “good.”
Q. Does AT&T My Results show Wi-Fi issues?
No. att my results does not diagnose Wi-Fi problems. It reports line health to the gateway only. Weak Wi-Fi, interference, or router placement issues will not appear in the dashboard.
Q. Why is AT&T My Results not working?
AT&T My Results may fail to load due to session timeouts, ad blockers, browser cache issues, or temporary tool outages. Clearing cookies, disabling aggressive blockers, and re-logging into your AT&T account usually fixes blank pages.
Q. Can AT&T see my internet activity through My Results?
No. AT&T My Results does not show your browsing activity. It displays network performance metrics such as speed, latency, and stability—not the websites you visit or content you access.
Q. What does packet loss mean in AT&T My Results?
Packet loss in att my results means data packets are being dropped, which causes buffering, video call freezes, and lag. Repeated packet loss usually indicates network instability or interference.
Q. Why do My Results and third-party speed tests differ?
Third-party speed tests measure your device and Wi-Fi performance, while AT&T My Results measures the line to your gateway. Differences happen when Wi-Fi is weak, devices are overloaded, or background uploads are active.
Q. How long do AT&T My Results take to update?
Speed test results in att my results update within minutes, but stability and line health indicators may take longer to refresh during outages or network congestion.
Final Verdict: Are ATT My Results Actually Accurate in 2026?
Yes—for line health. No—for lived experience.
In 2026, att my results are tightly integrated with AT&T Smart Home Manager and used to decide escalations. Treat it like a blood-pressure reading for your connection: useful, but not the whole story. Pair it with Ethernet testing, latency benchmarks, and real-world symptoms to get fixes—and credits—faster.
Related: eSIM USA: The Future of Mobile Connectivity in the United States